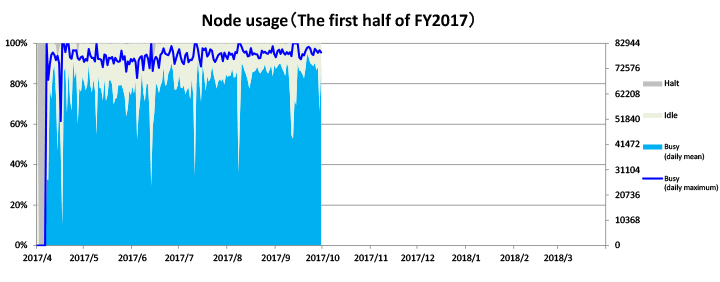

Node Usage in FY2017
This graph shows usage of 82,944 nodes of the K computer by day.
- Halt – The average number of halted nodes due to system maintenance for the day
- Idle – The average number of nodes on stand-by for the day
- Busy (daily mean) – The average number of used nodes for the day
- Busy (daily maximum) – The maximum number of used nodes for the day
- System maintenance for fiscal year-end from Apr 1 at midnight to Apr 8 at 11:35, 2017
The chart is updated in October and April.


