


- Menu
Node Usage
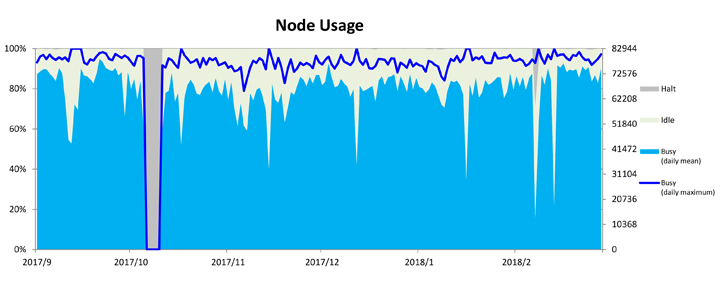
This graph shows usage of 82,944 nodes of the K computer for the latest 6 months by day.
- Halt – The average number of halted nodes due to system maintenance for the day
- Idle – The average number of nodes on stand-by for the day
- Busy (daily mean) – The average number of used nodes for the day
- Busy (daily maximum) – The maximum number of used nodes for the day
- System maintenance along with power outage of maintenance of electric power facility from Oct 6 to Oct 11, 2017
The chart is updated every month.
Report for FY2017 (The first half of FY2017)Report for FY2016
Report for FY2015
Report for FY2014
Report for FY2013
Report for FY2012