


- Menu
Computational Resource Usage
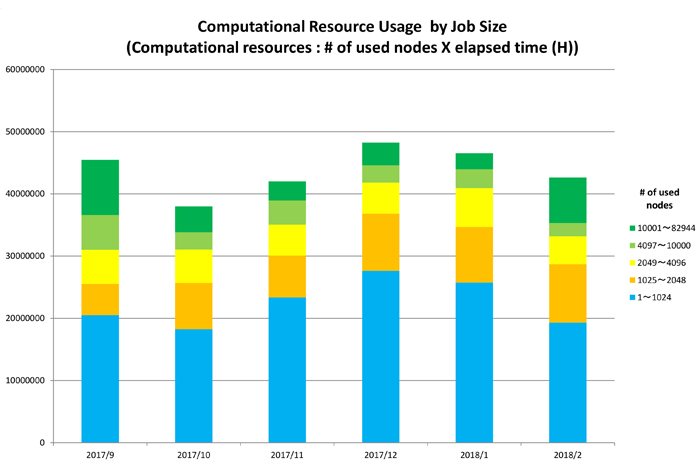
The graph shows computational resource (the number of used nodes multiple elapsed hours) usage for the latest 6 months by job size on monthly basis.
The colors indicate the number of used nodes of the job.
i.e. Blue color shows computational resource usage for the job using 1-1024 nodes.
The chart is updated every month.
Report for FY2017 (The first half of FY2017)
Report for FY2016
Report for FY2015
Report for FY2014
Report for FY2013
Report for FY2012